RxPhantom wrote: ↑2 years ago
So...ummm...I have a confession to make:
.
.
.
.
*whoosh*
Well I assume that means you're vaguely curious. I find this immensely interesting so if you're curious here's a TL;DR explanation. I have 10 EDH decks, so 1000 cards. I made a list of all those cards and got my computer to look up the date that each card was printed. Then I messed around with the list a bunch to see if I'd learn anything.
The first thing I did was find the median age (basically just the average but calculated slightly differently) of the cards in my decks (not including basic lands because that'll abnormally drag the average age down). Those numbers are as follows.
Median card age of each deck
Golos Storm - 2004.0
Dredge - 2007.0
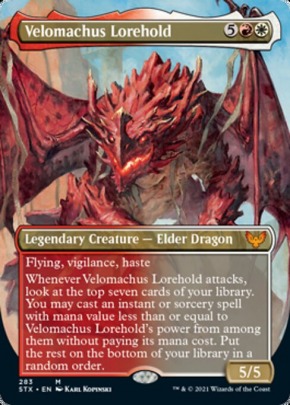
Chromium - 2008.0
Changeling - 2008.5
Jaya - 2009.0
Lasav - 2011.0
High CMC - 2012.0
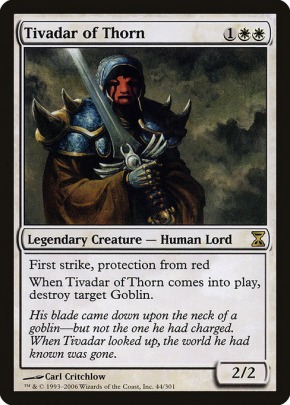
Tivadar - 2013.0
Boros Polymorph - 2015.0
Dinos - 2017.0
So the average year the cards in my Golos Storm deck were printed was 2004.
The average year the cards in my Dinos deck were printed was 2017.
Basically my golos storm deck has been way way less affected by recent printings than my Dinos deck which makes sense because my golos deck runs a mana base of all duals and has a ton of old elves and spells in it. While there aren't really any good old dinos as that is a tribe that only got support around Ixalan (in 2017).
As for the graphs...
They're histograms, so just bar graphs that record the number of cards per length of time. Here's a slightly more digestible version. (Ignore the title of the graph I forgot to change it, the graph is all non-basic lands in my 10 decks).

So I'm playing 47 cards that were first printed between 1993 and 1997. I'm playing 213 cards printed between 2017 and Strixhaven.

So I'm playing 23 cards from 1993 and only 22 cards from 2021.
Dragoon wrote: ↑2 years ago
The recent years (2016-2020) seem to have performed really well, but 2007 seems like a pretty big outlier for you (except for non-creatures where 2019 has the lion share). Did you start (or seriously restart) playing magic around that time?
There's a bunch of promos that get filled under the year that the promos line got started. So
Etali, Primal Storm was getting registered as 2007 instead of 2017. Annoying. I should have it fixed, but I don't have time to repost the graphs today. Likely can tomorrow.
As for my code. I'll try to post it in the near future. It's a hot indecipherable mess right now though. I'll want to pretty it up some first. Probably be a week or two. I'd recommend downloading Pokken's code. His is way more professional than mine since I'm still very new to this.